Metadata
aliases: []
shorthands: {}
created: 2022-07-08 17:23:21
modified: 2022-07-08 17:40:49
Suppose we have VTK output files from LIGGGHTS of some simulations just like the ones of January 2022. Then we have several methods to approximate the shape and position of the shear zone in each time step/output file.
We can load the positions, velocities, etc. of the particles shown in Opening LIGGGTHS output VTK files in Python:
coords = vtk_to_numpy(output.GetPoints().GetData())
vs = vtk_to_numpy(output.GetPointData().GetArray(3))
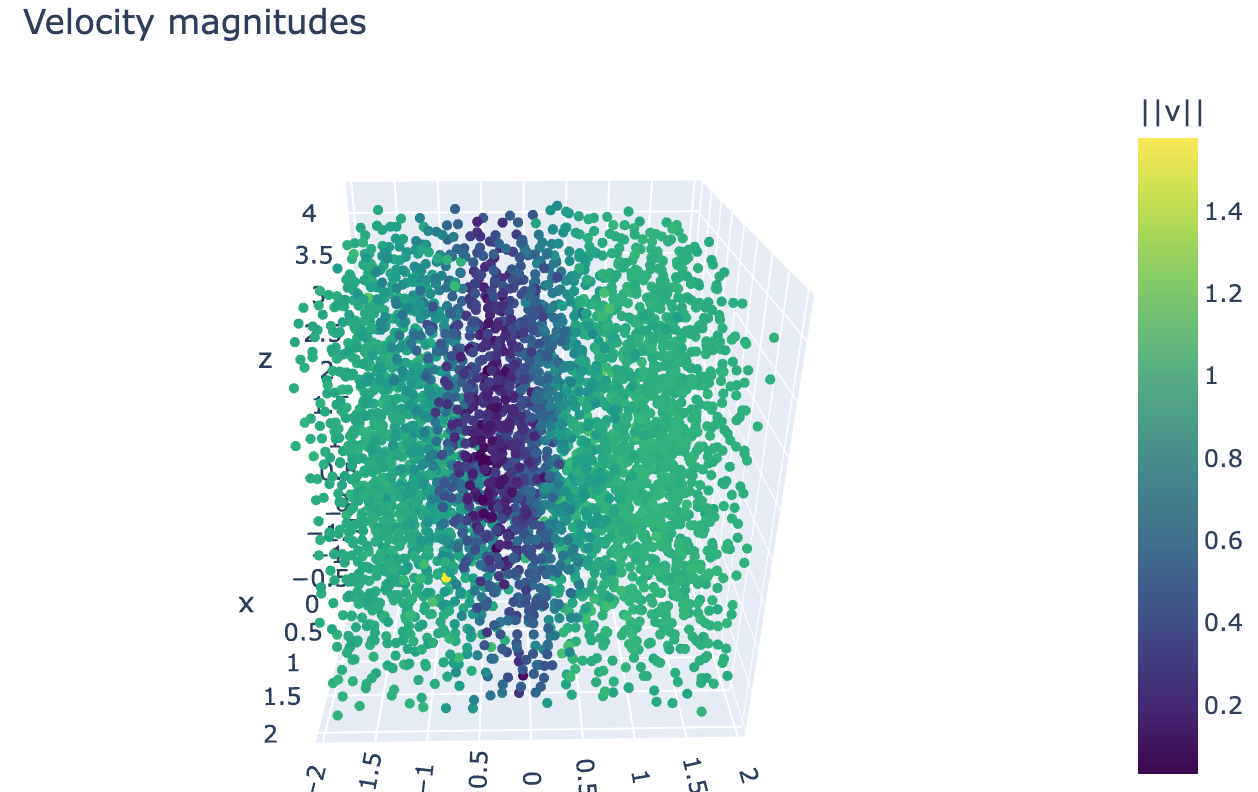
Let's first visualize the velocities of the particles using a scatter plot in plotly for later reference (this is a random example taken from a random output file):
import plotly.graph_objects as go

fig = go.Figure(data=[go.Scatter3d(x=coords[:, 0], y=coords[:, 1], z=coords[:, 2],
                                   mode='markers',
                                   marker=dict(
    size=3, color=np.sqrt(vs[:, 0]*vs[:, 0]+vs[:, 1]*vs[:, 1]+vs[:, 2]*vs[:, 2]),
    colorbar=dict(title='||v||'),
    colorscale='Viridis',
    showscale=True))])
fig.update_layout(width=650, height=400, margin=dict(
    l=0, r=0, b=0, t=40), title="Velocity magnitudes")
fig.show()
Which results in this, where we can clearly see the shear zone:
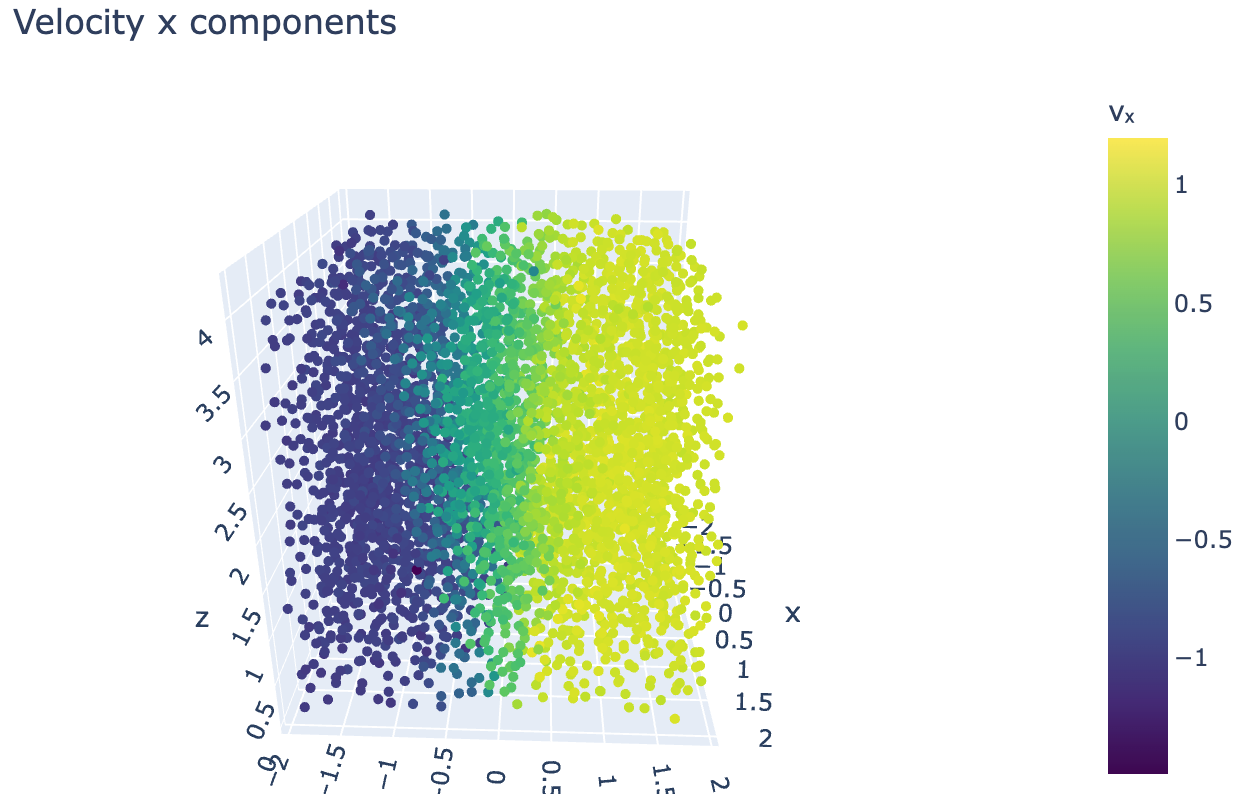
We can also just visualize the color option to vs[:, 0]. Then we get:
We can use several different methods to determine which particles are in the shearing zone. Here's a list of them: